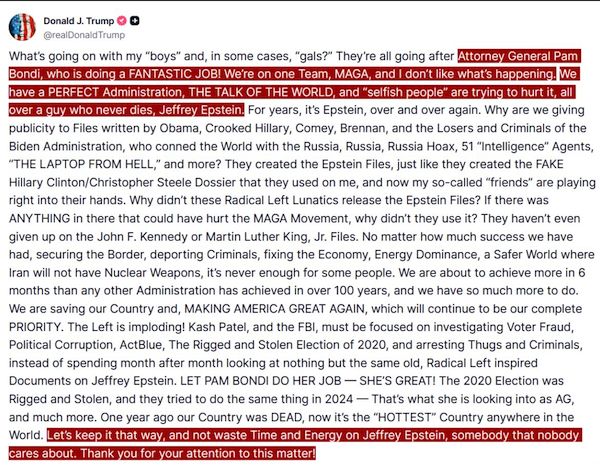
The first was the Trump administration abruptly ending the investigation of Jeffrey Epstein. Above is a post by President Trump from Saturday, urging his MAGA followers to just forget about the whole, sordid, mess of pedophilia and human trafficking and move on. Ain't gonna happen. Shutting down the investigation with no findings of blackmail, no lists of clients, and the absurd contention that Epstein committed suicide in prison is going to stick with this administration - and Mr. Trump in particular - for the rest of his term. Support for the America First agenda, MAGA, and all th patriotic bullshit is fading rapidly. If the administration doesn't come clean on this, nobody will ever trust them again.
After four years of Biden idiocy, the American public is in no mood to bear more lies and deflections from the federal government. People are fed up with government in general and many - in and out of the MAGA movement, on the right and the left - are quietly disengaging. The government is too deeply intertwined into people's lives and there are actions being taken by individuals at various levels of engagement to free themselves from what they consider to be a rogue, criminal operation, run by a uniparty with hidden agendas.
Stonewalling the Epstein affair pushes the truly patriotic followers further away from Trump, who has broken promises made during the campaign, and the government in general. People on the left and the right are now in agreement on many issues. The potential for widespread civil disobedience, civil war, or outright revolution is growing. It's possible that the government would like nothing more than civil war or rebellion, which would give them all the more rationale to impose martial law and stomp the population into jackboot submission. Smart Americans are unlikely to give them that opportunity, preferring quiet actions over violence.
Number two on the week's big events is actually a combination of two disparate occurrences: the BRICS Summit in Brazil and Trump tariffs, round two. They dovetail because Trump threatened BRICS countries with addition 10% tariffs, and also socked Brazil with a destructive, mendacious 50% tariff. Tariffs will prove to be the ruin of the U.S. economy. The government will prosper at the expense of consumers, who will see either higher prices (already happening), lower quality products from exporters to the U.S., or empty shelves if enough countries disengage from U.S. trade.
Meanwhile, BRICS are moving on, promoting international trade using their own currencies, bypassing the U.S. dollar completely. BRICS countries and those aligned with them will eventually isolate the United States as the bi-polar East-West split accelerates.
Third, and maybe the most important development, was the rapid price advance of silver, which over the course of just two days - Thursday and Friday - posted a gain of 6.5%, from $36.69 to $39.08 on the COMEX.
Gains like that don't happen in a vacuum. They are part and parcel of bigger agendas, larger trends and developments. Silver is a key industrial element and has thousands of years of history as money. Recent gains - outpacing every asset except the phony blockchain Ponzi scheme of bitcoin and other crypto frauds - are part of a larger movement, freeing silver and gold from the fiat currency monopoly.
Notice that none of these events have anything to do with stocks or bonds, the paper promises promoted by Western governments that are not only wildly overvalued, but ultimately subject to extreme volatility and manipulation. Every market is manipulated, but none as severely as stocks and fixed income (bonds).
The world is moving away from U.S. dominance toward a more free, equitable, honest future. The time is short.
Stocks
All of the majors ended the week on the downside, with the exception of the 20 stocks comprising the Dow Jones Transportation Average, which was up 1.01% for the week.
As the week just past offered little in the way of economic data or earnings, the upcoming week will be loaded, and especially front-loaded with bank and financial stocks, with a liberal dose of Dow components added in for flavor.
Stocks reporting second quarter earnings this week:
Monday (before open) Fastenal (FAST); (after close) FirstBank (FBK)
Tuesday (before open) JP Morgan Chase (JPM), Citigroup (C), Wells Fargo (WFC), BlackRock (BLK), State Street (STT), Bank of New York Mellon (BK) Albertsons (ACI), Ericsson (ERIC); (after close) J.B. Hunt (JBHT), Pinnacle Financial (PNFP)
Wednesday (before open) Bank of America (BAC), Goldman Sachs (GS), Morgan Stanley (MS), Johnson & Johnson (JNJ), PNC Bank (PNC, ASML (ASML); (after close) Synovus (SNV), Alcoa (AA), Kinder Morgan (KMI), United Airlines (UAL)
Thursday (before open) Taiwan Semi (TSMC), Cintas (CTAS), US Bancorp (USB), Fifth Third Bank (FITB), Travelers (TRV), Abbot Labs (ABT), Pepsico (PEP); (after close) Simmons Bank (SFNC), Bank of the Ozarks (OZK), Netflix (NFLX), Interactive Brokers (IBKR)
Friday (before open) Huntington Bank (HBAN), Truist Financial (TFC), American Express (AXP), Ally Bank (ALLY), 3M (MMM), Regions Bank (RF), Charles Schwab (SCHW), Comerica (CMA).
Highlighting the data front will be June CPI and PPI, Tuesday and Wednesday, respectively. Capacity Utilization and Industrial Production for June is also out on Wednesday. June Retail Sales appear Thursday morning, along with the Philly Fed and the NAHB Housing Market Index.
If you think June's CPI data being released on the same morning as second quarter earnings from JP Morgan Chase, Citigroup, Wells Fargo, BlackRock, State Street, and Bank of New York Mellon, is just a coincidence, you just don't get it. Look for the banks to report massive profits and the CPI to edge up slightly, so "investors" will focus on bank stocks and ignore the re-ignition of inflation.
Treasury Yield Curve Rates
| Date | 1 Mo | 1.5 mo | 2 Mo | 3 Mo | 4 Mo | 6 Mo | 1 Yr |
| 06/06/2025 | 4.28 | 4.31 | 4.35 | 4.43 | 4.38 | 4.31 | 4.14 |
| 06/13/2025 | 4.23 | 4.32 | 4.48 | 4.45 | 4.40 | 4.30 | 4.09 |
| 06/20/2025 | 4.20 | 4.38 | 4.55 | 4.39 | 4.40 | 4.29 | 4.07 |
| 06/27/2025 | 4.19 | 4.43 | 4.49 | 4.39 | 4.36 | 4.26 | 3.97 |
| 07/03/2025 | 4.35 | 4.43 | 4.50 | 4.42 | 4.41 | 4.34 | 4.07 |
| 07/11/2025 | 4.37 | 4.39 | 4.47 | 4.41 | 4.42 | 4.31 | 4.09 |
| Date | 2 Yr | 3 Yr | 5 Yr | 7 Yr | 10 Yr | 20 Yr | 30 Yr |
| 06/06/2025 | 4.04 | 4.02 | 4.13 | 4.31 | 4.51 | 4.99 | 4.97 |
| 06/13/2025 | 3.96 | 3.90 | 4.02 | 4.20 | 4.41 | 4.93 | 4.90 |
| 06/20/2025 | 3.90 | 3.86 | 3.96 | 4.16 | 4.38 | 4.90 | 4.89 |
| 06/27/2025 | 3.73 | 3.72 | 3.83 | 4.03 | 4.29 | 4.85 | 4.85 |
| 07/03/2025 | 3.88 | 3.84 | 3.94 | 4.12 | 4.35 | 4.87 | 4.86 |
| 07/11/2025 | 3.90 | 3.86 | 3.99 | 4.19 | 4.43 | 4.96 | 4.96 |
Notice how interest rates crept up on the week, with the bulk of yield gain coming on Friday, the same day stocks were down. In other words, instead of rushing into the safety of fixed income as stocks were being somewhat clobbered (especially the DOW), bonds were being sold off as well. Where did the money go? Cash, gold, silver.
The 10-year note was up eight basis points and the 30-year bond up 10 on Friday. This is no coincidence. This is an early warning sign of an upcoming financial crisis. Everybody knows that a financial crisis will occur - it's only a matter of time - the question is when and what will be the cause. Speculation is that the repo market will explode again or that some banks might be found to be undercapitalized and overly aggressive in their treasury distribution.
The current narrative that inflation is under control, approaching two percent (meaning your money devalues by half in 30 years, instead of 20 years at three percent) annually, is about to change. Inflation has never been under control. Prices have been rising, especially lately, as in the past few months. Those who do grocery shopping understand this all too well.
Instead of cutting rates, the Fed should be raising them. Will they? Probably not. They are more likely to cut rates to stave off a recession (can't have those!) than raise them to shut down inflation.
Full spectrum spread fom 30 days out to 30 years remains elevated at +59. 2s-10s are back to April highs, at +53.
Be on guard for the 30-year bond to hit five percent and higher, and the 10-year note to exceed a yield of 4.5%. The Treasury market is under severe stress, from lack of foreign buying to unease over economic conditions caused by continuing deficits and lack of capital formation.
Spreads:
2s-10s
9/15/2023: -69
9/22/2023: -66
9/29/2023: -44
10/06/2023: -30
10/13/2023: -41
10/20/2023: -14
10/27/2023: -15
11/03/2023: -26
11/10/2023: -43
11/17/2023: -44
11/24/2023: -45
12/01/2023: -34
12/08/2023: -48
12/15/2023: -53
12/22/2023: -41
12/29/2023: -35
1/5/2024: -35
1/12/2024: -18
1/19/2024: -24
1/26/2024: -19
2/2/2024: -33
2/9: -31
2/16: -34
2/23: -41
3/1: -35
3/8: -39
3/15: -41
3/22: -37
3/28: -39
4/5: -34
4/12: -38
4/19: -35
4/26: -29
5/3: -31
5/10: -37
5/17: -39
5/24: -47
5/31: -38
6/7: -44
6/14: -47
6/21: -45
6/28: -35
7/5: -32
7/12: -27
7/19: -24
7/26: -16
8/2: -08
8/9: -11
8/16: -17
8/23: -09
8/30: 00
9/6: +06
9/13: +09
9/20: +18
9/27: +20
10/4: +5
10/11: +13
10/18: +13
10/25: +14
11/1: +16
11/8: +5
11/15: +12
11/22: +4
11/29: +5
12/6: +5
12/13: +15
12/20: +22
12/27: +31
1/3: +32
1/10: +37
1/17: +34
1/24: +36
1/31: +36
2/7: +20
2/14: +21
2/21: +23
2/28: +25
3/7: +33
3/14: +29
3/21: +31
3/28: +38
4/4: +33
4/11: +52
4/17: +53
4/25: +55
5/2: +50
5/9: +49
5/16: +45
5/23: +51
5/30: +52
6/6: +48
6/13: +45
6/20: +48
6/27: +56
7/3: +47
7/11: +53
Full Spectrum (30-days - 30-years)
9/15/2023: -109
9/22/2023: -99
9/29/2023: -82
10/06/2023: -64
10/13/2023: -82
10/20/2023: -47
10/27/2023: -54
11/03/2023: -76
11/10/2023: -80
11/17/2023: -93
11/24/2023: -95
12/01/2023: -105
12/08/2023: -123
12/15/2023: -154
12/22/2023: -149
12/29/2023: -157
1/5/2024: -133
1/12/2024: -135
1/19/2024: -118
1/26/2024: -116
2/2/2024: -127
2/9: -117
2/16: -103
2/23: -112
3/1: -121
3/8: -125
3/15: -109
3/22: -112
3/28: -115
4/5: -93
4/12: -87
4/19: -77
4/26: -70
5/3: -85
5/10: -87
5/17: -94
5/24: -99
5/31: -83
6/7: -92
6/14: -113
6/21: -103
6/28: -96
7/5: -101
7/12: -108
7/19: -103
7/26: -104
8/2: -143
8/9: -131
8/16: -138
8/23: -141
8/30: -121
9/6: -125
9/13: -117
9/20: -80
9/27: -80
10/4: -75
10/11: -58
10/18: -54
10/25: -38
11/1: -18
11/8: -23
11/15: -10
11/22: -12
11/29: -40
12/6: -23
12/13: +18
12/20: +29
12/27: +38
1/3: +38
1/10: +54
1/17: +41
1/24: +40
1/31: +36
2/7: +32
2/14: +32
2/21: +31
2/28: +13
3/7: +24
3/14: +25
3/21: +23
3/28: +26
4/4: +5
4/11: +38
4/17: +44
4/25: +40
5/2: +41
5/9: +46
5/16: +52
5/23: +68
5/30: +59
6/6: +69
6/13: +67
6/20: +69
6/27: +66
7/3: +51
7/11: +59
Oil/Gas
WTI crude oil closed out the week at $67.35, a $2.20 increase from last Friday's $65.15. The gain was largely synthetic, with traders adjusting after the major downdraft at the end of June. Call it a knee-jerk reaction to much lower pricing which will probably prove to be both short-lived and wrong-footed.
Gas prices have followed oil's path lower in general.
Gasbuddy.com is reporting the national average for a gallon of unleaded regular gas at the pump at $3.13, a two-cent gain from last week, mostly insignificant.
The highest prices in the country were in California, as usual, at $4.50, down four cents on the week.
Prices at the traditional low end have settled, but were mostly higher, led by Mississippi ($2.68), Oklahoma ($2.71), Alabama and Louisiana ($2.75). Other states in the Southeast are all between $2.76 (South Carolina, Texas) and $2.79 (Arkansas), with the notable exceptions of Georgia ($2.87), North Carolina ($2.88), and Florida ($2.91). 12 states under the 42nd parallel are below $3.00, including New Mexico.
The Northeast continues to be led on the high side by Pennsylvania ($3.25), down six cents. All other New England and East coast states remained above $3.00, ranging from Massachusetts at $3.02 to New York at $3.15, except for New Hampshire ($2.98).
Midwest states are topped by Illinois ($3.47), the price up six cents on the week. Nebraska ($2.82)is lowest in the region, followed by Kansas ($2.87), North Dakota ($2.88), and Missouri ($2.89). Along with Illinois, Wisconsin ($3.01), Ohio ($3.05), Indiana and Minnesota ($3.06), and Michigan ($3.27) are all back above $3.00.
Along with California, Washington ($4.40) is the only other one above $4, as Oregon checks in at $3.98. Nevada ($3.70) dropped two cents. Arizona ($3.17) is still priced at a premium to neighboring New Mexico, a relative bargain, at $2.84. Idaho ($3.44) was up a nickel, and Utah ($3.27) was unchanged.
Sub-$3.00 gas can be found in one fewer state this week than last, with now 21 making the grade. Prices could go either way. It's political.
Bitcoin
This week: $119,022.00
Last week: $108,808.00
2 weeks ago: $108,168.60
6 months ago: $95,099.77
One year ago: $59,477.68
Five years ago: $9,177.39
New highs. Bitcoin is the gateway drug to controllable, programmable, government digital currency, CBDC, so good luck with your crypto fantasy.
Precious Metals
Gold:Silver Ratio: 86.24; last week: 90.13
Per COMEX continuous contracts:
Gold price 6/13: $3,452.60
Gold price 6/20: $3,384.40
Gold price 6/27: $3,286.10
Gold price 7/3: $3,346.50
Gold price 7/11: $3,370.30
Silver price 6/13: $36.37
Silver price 6/20: $35.95
Silver price 6/27: $36.17
Silver price 7/3: $37.13
Silver price 7/11: $39.08
Both gold and silver were bid on the week, but the big story was silver, closing above $39.00 an ounce on the COMEX, with spot at $38.34. What triggered silver's rise was likely related to U.S. President Trump calling for a 50% tariff on copper. A good portion of silver mined around the world is as a by-product of other mining, copper being prominent.
The gains on silver, which many believe to be long overdue come at a time when there are more than ample numbers of catalysts, main among them being the silver shortfall in production, mining not keeping pace with demand for what appears to be a fifth straight year, according to the Silver Institute.
On a more technical level, the recent gold:silver ratio bounding over 100 was a certain buy signal for metals dealers, stackers, and investors. It was so far out of whack that it prompted silver sales to outpace supplies and now, the restocking of inventory is pushing the price even higher, so much so that the GSR checks in this week at a more rational 86.24.
As always, when gold rises, silver usually catches up and then exceeds in percentage terms, which is now the case. Gold is up 27.38% year-to-date, while silver has passed it by, up 33.24%. On a five-year scale, silver is up 97.17%, gold, 85.86%, These are the kinds of numbers that should put some of the whining about silver's poor performance to rest. It's even outpacing the S&P 500 over the past five years (94.12%). Not bad for an assets without counter-party risk that has been accepted as MONEY for millennia.
The narrative promoted by central banks since the so-called "Crime of '73" when the U.S. demonetized the metal, disallowing the U.S. Mint from turning citizen silver into silver coinage.
In 1965, silver was taken further out of circulation with the Coinage Act of 1965, eliminating silver dimes and quarters and reducing the content of silver in the half dollar from 90% to 40% (Kennedy halves).
Readers of Money Daily are likely to be acutely aware of silver's constitutional status as money in the United States. Sooner or later, there's going to be a crisis that will force the hand of government to default on the Federal Reserve's fiat currency. Whether it restores the U.S. to honest money remains a mystery, but, rest assured, the rest of the world is not going to wait around for the United States. Central banks around the world have been buying up gold hand over fist, and now some are going to be looking seriously at silver as a strategic asset and possibly a basis for currency. Peru and Mexico would be prime candidates for a re-monetizing of silver as both countries mine massive amounts of it a year.
In 2024, again, using Silver Institute figures, four of the top five silver-producing countries are in South America and five of the top 10. Here's the breakdown for 2024 production in millions of ounces:
Mexico: 185.7
China: 110.1
Peru: 108.0
Bolivia: 47.8
Chile: 43.2
Poland: 42.5
Russia: 41.0
Australia: 38.8
United States: 36.2
Argntina: 24.9
Also of note, Russia formally announced adding silver to its central bank holdings more than a year ago, and China's position at #2 in terms of production adds more speculation towards silver's role in the BRICS and the emerging global, multi-polar financial framework. Simply put, gold could be the vehicle for trade settlement between nations; silver the choice for individuals and small businesses. Could happen, but probably not overnight.
In the meantime, keep stacking.
Here are the most recent prices for common one ounce gold and silver items sold on eBay (numismatics excluded, free shipping):
| Item/Price | Low | High | Average | Median |
| 1 oz silver coin: | 39.00 | 52.50 | 45.34 | 44.98 |
| 1 oz silver bar: | 41.01 | 49.95 | 45.35 | 45.00 |
| 1 oz gold coin: | 3,451.10 | 3,633.43 | 3,517.89 | 3,517.23 |
| 1 oz gold bar: | 3,500.92 | 3,533.53 | 3,515.58 | 3,513.72 |
The Single Ounce Silver Market Price Benchmark (SOSMPB) rose dramatically this week, to $45.17, an improvement of $1.61 from the June 29 price of $43.56 per troy ounce.
WEEKEND WRAP
Money Daily is gradually moving toward a non-U.S.-centric approach to coverage of the global economy. While it's clear that enormous changes are underway, they are generally very slow to develop. The U.S. and the West are not becoming irrelevant, it's just that the systems they employ have broken down and their governments and central bankers execute a daily ongoing scramble to keep those systems operational.
On the other side of the ledger, so to speak, are BRICS and countries aligned to them, which are in the process of building what they propose as a better system. Ultimately, the use of gold as backing for currencies will be essential, but not without a lot of pain and suffering - mostly by innocent people - first.
Sound financial management is moving West to East. South America and Africa are likely to be key battlegrounds in economics over the coming years.
At the Close, Friday, July 11, 2025:
Dow: 44,371.51, -279.13 (-0.63%)
NASDAQ: 20,585.53, -45.17 (-0.22%)
S&P 500: 6,259.75, -20.71 (-0.33%)
NYSE Composite: 20,547.67, -130.43 (-0.63%)
For the Week:
Dow: -457.02 (-1.02%)
NASDAQ: -15.57 (-0.08%)
S&P 500: -19.60 (-0.31%)
NYSE Composite: -178.12 (-0.86%)
Dow Transports: +162.03 (+1.01%)
Disclaimer: Information disseminated on this site should not be construed as investment advice. Downtown Magazine Inc., Money Daily and it's owners, affiliates and/or employees are not investment advisors and do not offer specific investment advice. All investments have risk. You should consult a professional investment advisor or stock broker or use your individual judgement when making investment decisions. By viewing this site, you hold harmless Downtown Magazine Inc., Money Daily, its owners, affiliates and employees against any and all liability. Copyright 2025, Downtown Magazine Inc., all rights reserved.


No comments:
Post a Comment