Various media reports indicate that the full entourage of European dunderheads will accompany Ukrainian dictator, Zelensky to Washington for Monday's meeting with President Trump, including NATO Secretary General Rutte, French President Macron, UK Prime Minister Starmer, German Chancellor Merz, Italian Prime Minister Meloni, and Finnish President Stubb may also fly to Washington along with Zelenskyy. More names could be added.
A great deal of what transpires in global markets this coming week and beyond will be dictated by the outcome of Monday's White House confab, making matters difficult to discern until there's concrete evidence of either a continuation of hostilities with Russia or concessions toward ending the conflict.
Advice: Stay tuned.
Stocks
 The good news is that the Dow Jones Industrial Average finished the week solidly in positive territory. The bad news is it once again failed to reach all-time highs on a closing basis. The expected boost from the revelation that Warren Buffett's Berkshire Hathaway initiated a large stake in United Health (UNH) was offest by 17 of the 30 Dow stocks finishing in the red on Friday. UNH did produce a gain of nearly 12 percent, but it wasn't enough to get it over the bar. Only six of 13 stocks on the Dow that gained on Friday were up more than one percent.
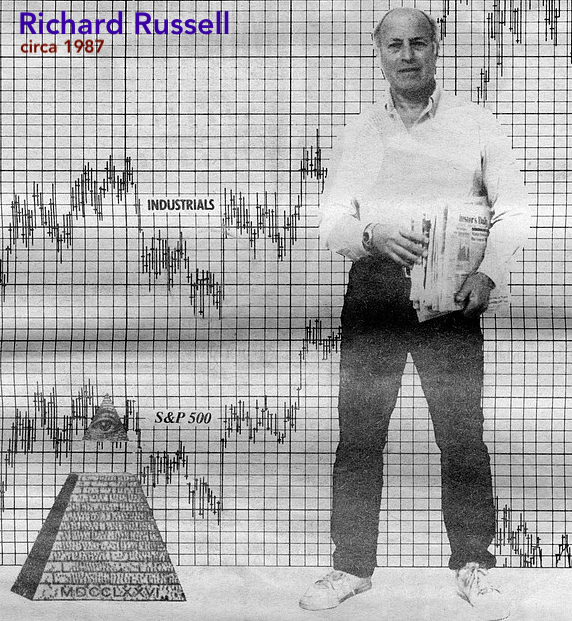
Friday's trading was jittery and had almost a random quality to it, with little conviction on the whole. Thus, the Dow remains the one major index that hasn't made a new high. It continues to trade below the December 4, 2024 close of 45,014.04. Along with that, the Dow Jones Transportation Average confirms the bearish primary trend according to Dow Theory, an art of market understanding that has become nearly extinct since the passing of its last great promoter, Richard Russell (July 22, 1924 – November 21, 2015), publisher of the Dow Theory Letter from 1952 until just before his passing.
One of the greatest and easiest derivations from Dow Theory is its natural ability to capture primary trends in a macro sense. While the components of the Dow Industrials change on irregular intervals, the addition of new components and deletion of others normally can be considered a function of keeping the index a reasonable reflection of American big business with a subtle leaning toward better-performing companies. After all, since the entire structure of Wall Street and stock markets is to sell shares of companies to everybody and anybody with money, it makes perfect sense that the averages and indices would purposely reflect the market as a place to improve and enhance one's wealth.
Given that the Dow Industrials and Transports are - like just about everything else - manipulated by large money managers, banking interests, large funds, and the government to some degree, the fact that both of the averages have NOT escaped from bear market conditions offers an inkling of suspicion as to the overall bullishness of the other indices. It may be nothing at all, or it could be important. At the very least, all-time highs on the more speculative indices - NASDAQ and S&P large caps - while old man Dow Jones hasn't reached in eight months should give one pause and some insight before rushing in to buy stocks. An interesting retrospective on Russell is provided via the San Diego Reader archives.
Adding to the fear factor should be consideration of the Shiller PE, or CAPE, which stands at 38.84, second-highest ever. Whether traders take cues from market indicators or continue with the bubble "greater fool" theory of 21st-century investing is more a matter of media narratives and current sentiment than anything representing discipline and proper risk assessments. The U.S. markets are clearly overheated, but so is the money supply, and it has to go somewhere.
Topping? Probably not, especially if Monday's White House meeting leans towards a positive resolution in Ukraine.
Since April's tariff pause, NASDAQ has had 13 of 19 weeks to the upside; 12 of 19 for the S&P, both indices soaring above their respective 50-day moving averages since the beginning of May.
Stocks reporting this week will feature second quarter earnings mainly of major retail outfits, including:
Monday (before open) Bitdeer (BTDR); (after close) Palo Alto Networks (PANW), Blink (BLNK)
Tuesday (before open) Medtronic (MDT), Viking Cruise Lines (VIK), Home Depot (HD); (after close) Toll Brothers (TOL), Lazyboy (LZB)
Wednesday (before open) Estee Lauder (EL), TJX Holdings (TJX), Analog Devices (ADI), Target (TGT), Baidu (BIDU); (after close) Coty (COTY), Nordson (NDSN)
Thursday (before open) Walmart (WMT), Hovnanian Enterprises (HOV); (after close) Ross Stores (ROST), Inutit (INTU), Workday (WDAY)
Friday (before open) BJ's Wholesale (BJ).
The economic data calendar will be fairly light, starting with Tuesday's Building Permits and Housing Starts for July. Thursday brings forth unemployment claims, weekly energy data from the EIA, and the economic reading of the Philly Fed.
Friday's keynote address by Fed Chairman Jerome Powell at the annual Jackson Hole Economic Conference will be closely watched for indications on the Fed's outlook concerning inflation, employment, and interest rates. The promise of three rate cuts this year are more than likely to come up short, given that there are only three more FOMC meeting scheduled (September, November, December) and inflation continues stubbornly intractable.
Treasury Yield Curve Rates
| Date | 1 Mo | 1.5 mo | 2 Mo | 3 Mo | 4 Mo | 6 Mo | 1 Yr |
| 07/11/2025 | 4.37 | 4.39 | 4.47 | 4.41 | 4.42 | 4.31 | 4.09 |
| 07/18/2025 | 4.35 | 4.39 | 4.46 | 4.40 | 4.42 | 4.30 | 4.08 |
| 07/25/2025 | 4.37 | 4.46 | 4.46 | 4.42 | 4.42 | 4.31 | 4.09 |
| 08/01/2025 | 4.49 | 4.46 | 4.44 | 4.35 | 4.30 | 4.16 | 3.87 |
| 08/08/2025 | 4.48 | 4.43 | 4.39 | 4.32 | 4.27 | 4.15 | 3.93 |
| 08/15/2025 | 4.48 | 4.42 | 4.35 | 4.30 | 4.22 | 4.12 | 3.93 |
| Date | 2 Yr | 3 Yr | 5 Yr | 7 Yr | 10 Yr | 20 Yr | 30 Yr |
| 07/11/2025 | 3.90 | 3.86 | 3.99 | 4.19 | 4.43 | 4.96 | 4.96 |
| 07/18/2025 | 3.88 | 3.84 | 3.96 | 4.18 | 4.44 | 4.99 | 5.00 |
| 07/25/2025 | 3.91 | 3.86 | 3.95 | 4.15 | 4.40 | 4.92 | 4.92 |
| 08/01/2025 | 3.69 | 3.67 | 3.77 | 3.97 | 4.23 | 4.79 | 4.81 |
| 08/08/2025 | 3.76 | 3.70 | 3.84 | 4.03 | 4.27 | 4.84 | 4.85 |
| 08/15/2025 | 3.75 | 3.73 | 3.85 | 4.07 | 4.33 | 4.91 | 4.92 |
Treasury yields didn't move much over the course of the week, and the curve remains inverted from 30-day bills out to 10-year notes with the bottom at the 3-year (3.73%). From the 3-year note out to the 30-year bond, the curve steepens in normal fashion, though it's still rather alarming that it costs more to borrow for one month than it does for 10 years, the result of persistent high inflation. The Fed is reluctant to lower the base federal funds target rate out of fear that it woould lose what little control it exerts against inflationary forces in the first place.
Of course, if the Fed just stopped increasing the money supply, inflation would cease almost immediately, but that might cause a slowdown, otherwise known as a recession, and this Fed just can't have that, so they remain stuck in policy no-man's land. The people suggesting that the Fed will cut interest rates 25 or even 50 basis points at the September FOMC meeting (9/16-17) are apparently oblivious to the inflation data from the past week, with CPI remaining elevated and PPI coming in red hot.
The biggest moves in the treasury market came at the end of the curve, with 10-year notes up five basis points and 20 and 30-year bonds up seven. Demand for the longest maturities is waning, with buyers demanding more for their money. Once the tariff inflation hits - which could manifest anywhere from two months to six months out - expect the 30-year bond to scream past five percent and remain elevated.
Spreads:
2s-10s
9/15/2023: -69
9/22/2023: -66
9/29/2023: -44
10/06/2023: -30
10/13/2023: -41
10/20/2023: -14
10/27/2023: -15
11/03/2023: -26
11/10/2023: -43
11/17/2023: -44
11/24/2023: -45
12/01/2023: -34
12/08/2023: -48
12/15/2023: -53
12/22/2023: -41
12/29/2023: -35
1/5/2024: -35
1/12/2024: -18
1/19/2024: -24
1/26/2024: -19
2/2/2024: -33
2/9: -31
2/16: -34
2/23: -41
3/1: -35
3/8: -39
3/15: -41
3/22: -37
3/28: -39
4/5: -34
4/12: -38
4/19: -35
4/26: -29
5/3: -31
5/10: -37
5/17: -39
5/24: -47
5/31: -38
6/7: -44
6/14: -47
6/21: -45
6/28: -35
7/5: -32
7/12: -27
7/19: -24
7/26: -16
8/2: -08
8/9: -11
8/16: -17
8/23: -09
8/30: 00
9/6: +06
9/13: +09
9/20: +18
9/27: +20
10/4: +5
10/11: +13
10/18: +13
10/25: +14
11/1: +16
11/8: +5
11/15: +12
11/22: +4
11/29: +5
12/6: +5
12/13: +15
12/20: +22
12/27: +31
1/3: +32
1/10: +37
1/17: +34
1/24: +36
1/31: +36
2/7: +20
2/14: +21
2/21: +23
2/28: +25
3/7: +33
3/14: +29
3/21: +31
3/28: +38
4/4: +33
4/11: +52
4/17: +53
4/25: +55
5/2: +50
5/9: +49
5/16: +45
5/23: +51
5/30: +52
6/6: +48
6/13: +45
6/20: +48
6/27: +56
7/3: +47
7/11: +53
7/18: +56
7/25: +49
8/1: +54
8/8: +51
8/15: +58
Full Spectrum (30-days - 30-years)
9/15/2023: -109
9/22/2023: -99
9/29/2023: -82
10/06/2023: -64
10/13/2023: -82
10/20/2023: -47
10/27/2023: -54
11/03/2023: -76
11/10/2023: -80
11/17/2023: -93
11/24/2023: -95
12/01/2023: -105
12/08/2023: -123
12/15/2023: -154
12/22/2023: -149
12/29/2023: -157
1/5/2024: -133
1/12/2024: -135
1/19/2024: -118
1/26/2024: -116
2/2/2024: -127
2/9: -117
2/16: -103
2/23: -112
3/1: -121
3/8: -125
3/15: -109
3/22: -112
3/28: -115
4/5: -93
4/12: -87
4/19: -77
4/26: -70
5/3: -85
5/10: -87
5/17: -94
5/24: -99
5/31: -83
6/7: -92
6/14: -113
6/21: -103
6/28: -96
7/5: -101
7/12: -108
7/19: -103
7/26: -104
8/2: -143
8/9: -131
8/16: -138
8/23: -141
8/30: -121
9/6: -125
9/13: -117
9/20: -80
9/27: -80
10/4: -75
10/11: -58
10/18: -54
10/25: -38
11/1: -18
11/8: -23
11/15: -10
11/22: -12
11/29: -40
12/6: -23
12/13: +18
12/20: +29
12/27: +38
1/3: +38
1/10: +54
1/17: +41
1/24: +40
1/31: +36
2/7: +32
2/14: +32
2/21: +31
2/28: +13
3/7: +24
3/14: +25
3/21: +23
3/28: +26
4/4: +5
4/11: +38
4/17: +44
4/25: +40
5/2: +41
5/9: +46
5/16: +52
5/23: +68
5/30: +59
6/6: +69
6/13: +67
6/20: +69
6/27: +66
7/3: +51
7/11: +59
7/18: +65
7/25: +55
8/1: +32
8/8: +37
8/15: +44
Oil/Gas
WTI crude oil closed out the week near the lows, at $62.29, a drop of $1.06 from last week's close at $63.35 and off $4.97 from the close on June 1 of $67.26. Crude has hovered between correction and bear market since the January 15 peak of $78.71, currently down 20.86%, and seeking lower levels.
Crude's decline was tied primarily to a heavily-publicized meeting between America's President Trump and Russian President Vladimir Putin, which took place on Friday, the 15th, in Anchorage, Alaska, the idea being that if relations between the U.S. and Russia are normalized, the price of oil is going to bottom out around $55-62 per barrel, given fewer sanctions and open trade routes.
Oil's price decline may prove a boon to economies, especially those of Europe, given the outcome of the top-level discussions were positive. How the EU dimwits respond on Monday will play a huge role.
Gas prices have leveled off over the past month and remain near the low end. Gasbuddy.com reports the national average for a gallon of unleaded regular gas at the pump at $3.12, the same as last week.
Since gas prices aren't moving, state-by-state numbers are a waste of time. Suffice it to say that California remains at the top, at $4.48 per gallon, with Washington a close second, $4.39. In the Northeast, New Hampsire is lowest ($2.98), Pennsylvania, highest ($3.21).
Illinois is the standout in the Midwest, at $3.40 a gallon, while Kansas ($2.82) is the lowest.
All of the South, except Florida, from North Carolina to New Mexico, is sub-$3.00, with Mississippi the lowest in the country, at $2.67. The Sunshine State checked in at $3.06 Sunday morning.
Sub-$3.00 gas can be found in 22 states, one more than the prior week.
Bitcoin
This week: $118,309.30
Last week: $118,483.10
2 weeks ago: $113,838.20
6 months ago: $96,096.47
One year ago: $58,708.96
Five years ago: $11,676.19
Crypto is little more than slave money for the 21st century. Repackaged fiat in flashy technology, none of it has any intrinsic value of any kind. It cannot be seen, touched, mined, melted, torn, or altered in any physical manner. Crypto, and bitcoin in particular, is fully a figment of global imagination, hoarded by whales, who own 90% or more of the vacuous creations.
Precious Metals
Gold:Silver Ratio: 88.95; last week: 89.80
Per COMEX continuous contracts:
Gold price 7/18: $3,355.50
Gold price 7/25: $3,338.50
Gold price 8/1: $3,416.00
Gold price 8/8: $3,458.20
Gold price 8/15: $3,381.70
Silver price 7/18: $38.42
Silver price 7/25: $38.33
Silver price 8/1: $37.10
Silver price 8/8: $38.51
Silver price 8/15: $38.02
A serious effort was made this week by the usual suspects at the COMEX and LBMA, with extraordinary assistance from the Trump administration's tariff team of the U.S. Customs and Border Protection, to keep the price of gold from advancing toward the inevitable $3,500 level. Last Friday, June 8, a not-so-subtle announcement was made that 1 kilogram and 1000-ounce gold bars would face tariffs of up to 39%, the country-specific rate for Switzerland, where 30-40% of gold bars worldwide are refined.
After futures rocketed to record levels above $3,500, the administration issued a hasty statement, offering "clarification" in days ahead. On Monday, August 11, President Trump posted on Truth Social, "Gold will not be tariffed." There was not further commentary. It was enough to calm markets, though a social media post doesn't exactly cut it as clarification or official notice. In any case, futures fell, some insiders allegedly made a few million, and the gold price stabilized back into its recent range between $3,300 and $3,400. This week's drop is probably nothing to be concerned about, given everybody knows the price of gold is going to increase as long as the U.S. government continues running huge deficits and inflation remains above the Fed's target of two percent.
Silver took a bit of a hit, though it also wasn't severe. These prices cannot be held down indefinitely. The global economy is being stretched to the point of no return and purchasing power in dollars, euros, yen, and pounds is rapidly declining. Precious metals are one of the few alternatives for wealth preservation during these turbulent times.
Sunday's survey of prices paid on eBay revealed the true nature of separation from the physical and paper markets, especially as it concerns silver. While the COMEX, LBMA, PPT, and any other actors working to suppress silver's price may be perfectly content to keep the contracts for 1000-troy-ounce bars settled in fiat around $38.00 per ounce, it makes perfect sense that smaller denominations for physical delivery, especially down to one-ounce increments, would price consistently higher. Money Daily's benchmark price rose to $46.08 this week, an all-time high.
Records which date back to January, 2021, employing a methodology that has not varied since inception, cannot be false and have consistently provided reliable price points for smaller, incremental, finished silver. While the difference between COMEX futures prices and physical sale prices is great, that variable has been consistent over time in consideration of labor, processing, and material employed in breaking down larger denominations into smaller ones, stamping, polishing, and delivery of finished products. The price also reflects the 13.6% fees charged by eBay on the total purchase. While it can reasonably be assumed that online dealers of size might receive better treatment in terms of fee structure, the exact terms are difficult to discern. The fee discounts probably amount to one to three percent.
Since free shipping is always one of the filters employed in determination of the SOSMPB, final prices paid on eBay sales represents true, delivered prices, without exception.
What this means for buyers and sellers in one of the world's largest open marketplaces for bullion (that being the eBay platform) is that the deviation and so-called "premium" on smaller denominations is reasonable, considering all variables. Anybody, from the collector looking to reduce his or her stack to the larger dealers such as Scottsdale, JM Bullion, Aydin, Liberty, Pinehurst, and many others, should expect sale prices roughly in line with Money Daily's SOSMPB, implying a premium of 20 percent or more, which is wholly in agreement with the processes, labor, and material costs outlined above.
Silver, although widely considered to be undervalued in many contexts and demonetized by central banking operations dating back at least 150 years, is still regarded by advocates as money and a perfectly rational store of value. The consistency of Money Daily's SOSMPB provides the proof and can be considered the North American standard for market pricing of one-troy-ounce finished silver. Gold prices, using the same metrics are also accurate and reliable, with physical prices consistently adding premia to COMEX-derived future paper prices. In the end, it's finished, delivered, physical goods that should project proper pricing. COMEX futures prices and LBMA daily fixes being nothing more than a guideline for bullion banks, central banks, and fiat-centric manipulators.
Here are the most recent prices for common one ounce gold and silver items sold on eBay (numismatics excluded, free shipping):
| Item/Price | Low | High | Average | Median |
| 1 oz silver coin: | 41.94 | 49.95 | 45.30 | 44.99 |
| 1 oz silver bar: | 39.80 | 49.99 | 46.78 | 47.25 |
| 1 oz gold coin: | 3,396.20 | 3,586.80 | 3,503.58 | 3,489.00 |
| 1 oz gold bar: | 3,481.21 | 3,562.25 | 3,503.50 | 3,495.00 |
The Single Ounce Silver Market Price Benchmark (SOSMPB) rose sharply through week, to $46.08, a gain of $1.35 from the August 10 price of $44.73 per troy ounce.
WEEKEND WRAP
Monday's meeting at the White House should provide some degree of understanding of how politics shapes the world going forward. Either the EU and Ukraine accept facts on the ground that Russia is winning massively or they fall back to their usual chants of "saving democracy" even though none exists in the blown-apart country. Since Putin and Trump appear to be the only sensible leaders concerned with ending the conflict, it's likely that the EU leadership will acquiesce to the Russian and American outlines for peace.
Details can be tricky and may contain some potholes and opportunity for the EU to sabotage the well-meaning of the Alaska summitt, though they realistically cannot prolong the war without substantial U.S. support. If Trump is at all serious, he will inform his European "partners" that the U.S. is out and a joint force of NATO and Russian observers and advisors will provide security guarantees of what remains of the rump country of Ukraine.
Otherwise, the status quo of stupidity and recalcitrance will remain, an outcome nobody outside of the EU-neocon-MIC junta will tolerate for much longer.
To say that the fate of the world hangs in the balance of Monday's White House conference may be putting it lightly. Those who want war will get their just deserts. Those seeking peace, as always, will have to guard their flanks.
At the Close, Friday, August 15, 2025:
Dow: 44,946.12, +34.86 (+0.08%)
NASDAQ: 21,622.98, -87.69 (-0.40%)
S&P 500: 6,449.80, -18.74 (-0.29%)
NYSE Composite: 20,802.68, -5.74 (-0.03%)
For the Week:
Dow: +770.51 (+1.74%)
NASDAQ: +172.96 (+0.81%)
S&P 500: +60.35 (+0.94%)
NYSE Composite: +278.44 (+1.36%)
Dow Transports: +321.71 (+2.10%)
Disclaimer: Information disseminated on this site should not be construed as investment advice. Downtown Magazine Inc., Money Daily and it's owners, affiliates and/or employees are not investment advisors and do not offer specific investment advice. All investments have risk. You should consult a professional investment advisor or stock broker or use your individual judgement when making investment decisions. By viewing this site, you hold harmless Downtown Magazine Inc., Money Daily, its owners, affiliates and employees against any and all liability. Copyright 2025, Downtown Magazine Inc., all rights reserved.


No comments:
Post a Comment